Performance and Python (I)
R. Checa-Garcia (CC BY-NC-SA) COMPUTING-BLOG
Scientific Computing Python
Notebook
In this post, I will introduce a python library quite useful to evaluate the most critical functions in your code (those that are most often called, and those where the program spent more time). To better understand how this library actually works, a good method is explain an example.
Therefore, I will use a numerical python code that I programmed to calculate the scattering properties of homogeneous spheres with Mie Scattering. The calculation needs the values of the Mie angular functions which are defined by recurrence relations (see this post ). Typically, we have to program functions like, \[S_{1}(\theta) = \sum_{n=1}^{N_{max}}\frac{2n+1}{n(n+1)}\left[ a_{n}\pi_{n}(\theta)+b_{n}\tau_{n}(\theta) \right]\]
where, \[\pi_{n}(\theta)=f(\pi_{n-1}(\theta),\pi_{n-2}(\theta))\] \[\tau_{n}(\theta)=g(\pi_{n-1}(\theta),\pi_{n-2}(\theta))\]
at this point the specific form of the functions \(f\) and \(g\) is not critical. But if we analized the equation of \(S_{1}(\theta)\) there is a sum of $\pi_{n}(\theta)$ for increasing values of n. Due to the recurrence definition we have to evaluate several times similar or identical expressions.
Let’s say that in first instance we are not aware of this fact, however we want to diagnose where the code spends more time and resources. For that we install the library:$ pip install pycallgraph
We could use the library like a bash shell program or import it within our program. In the first case,$ pycallgraph graphviz -- testTHIS.py
This will generate a image file pycallgraph.png. However, it is more useful and versatile to introduce directly in the script because it is possible to diagnose expecifically a function or block of code:import pymie_core as pymie
from pycallgraph import PyCallGraph
from pycallgraph.output import GraphvizOutput
with PyCallGraph(output=GraphvizOutput()):
pymie.mie_scat_lognormals(a_n, a_m, a_d, a_sig, a_mode)
In this case I would like to evaluate the function mie_scat_lognormals. Within this function mie_scat_lognormals of the library pymie_core are calculated series of the type: \(S_{1}(\theta)\).
If we just execute our python script we will find an image file, which in this case is,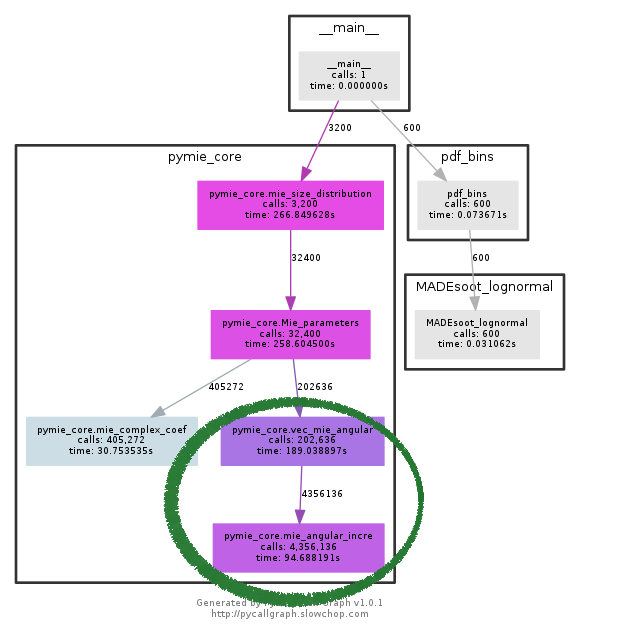
I have indicated the large number of evaluations of the Mie angular functions. Therefore this motivate check the code because any improvement would mean a much better performance. In this code, I introduced a main change storing in a numpy array the results of the mie angular functions to avoid the huge number of evaluations. The result of run again the python script is now,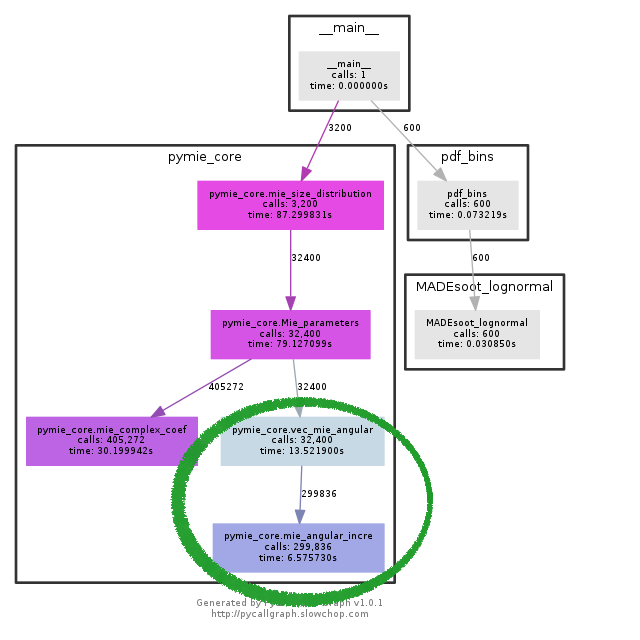
We appreciate that before there was \(4\,300\,000\) calls and after \(300\,000\) function calls. By using this library we could figure out where our code is spending more time and what functions are critical in terms of global perfomance.